#' Drawing sig barplot
#'
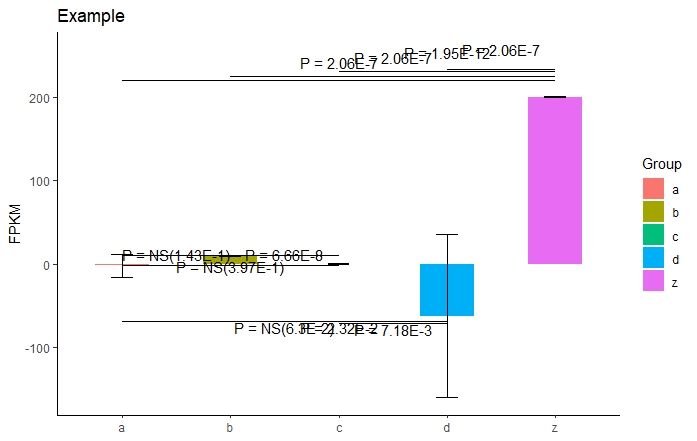
#' This function is to draw barplot with significant p.value code
#' ks.test, t.test and wilcox.test are available.
#' @param input_list (default=NULL) : Input list object with names.
#' @param test_method (default='t.test',character) : Test option parameter. You can also use ks.test and wilcox.test.
#' @param one.sided (default=F) : Whether p-values should be obtained by one.sided test
#' @param ns_visualize (default=FALSE) : Whether visualize nonsignificant notation should be drawn.
#' @param nsmall (default=1) : The minimum number of digits to the right of the decimal point. 0<=nsmall<=20
#' @param digits (default=3) : The minimum number of digits. See format function.
#' @param colors (default=NULL) : Boxplot color. Provide it as vector.
#' @param yaxis_lab (default=NULL) : Label of yaxis
#' @param title (default=NULL) : Title of the plot
#' @param n_of_numbers (default=5) : Total number of characters below decimal point that change p.value annotation into scientific annotation.\cr
#' ex(p.value=0.0000523 is 7 characters belowe decimal point)
#' @keywords ks-test, t-test, wilcox-test, boxplot
#' @export
#' @examples
#' input_list=list(a=rnorm(10,sd=10),b=rnorm(10,10),c=rnorm(20),d=rnorm(10,5,100),z=rnorm(100,200,1))
#' # T-test
#' sig_barplot(input_list=input_list,test_method='t.test',yaxis_lab='FPKM',ns_visualize=F)
#' sig_barplot(input_list=input_list,test_method='t.test',yaxis_lab='FPKM',ns_visualize=T) # Nonsignificant will be plotted
#' # KS-test
#' sig_barplot(input_list=input_list,test_method='ks.test',ns_visualize=T)
#' # Wilcox-test
#' sig_barplot(input_list=input_list,test_method='wilcox.test',ns_visualize=T)
#' # Colors
#' sig_barplot(input_list=input_list,test_method='wilcox.test',ns_visualize=T,colors=rainbow(4),title='Example',yaxis_lab='FPKM')
#' #jitterplot
#' sig_barplot(input_list=input_list,test_method='wilcox.test',ns_visualize=T,colors=rainbow(4),title='Example',yaxis_lab='FPKM',violin=T,jitter.only=T)
#input_list=input_list;test_method='t.test';yaxis_lab='FPKM';ns_visualize=F;nsmall=1;digits=3;n_of_numbers=5;jitter=T;title='Example';one.sided=T;xaxis_lab=NULL
sig_barplot=function(input_list=NULL,test_method='t.test',one.sided=F,
ns_visualize=F,nsmall=3,digits=3,yaxis_lab=NULL,xaxis_lab=NULL,
colors=NULL,
title=NULL,n_of_numbers=5){
if(is.null(input_list)){stop('Input data is empty. Terminate process')}
# Test the categories in pairwise
test_m=match.arg(test_method,choices = c('ks.test','t.test','wilcox.test'))
test_n=length(input_list)-1
test_res=c()
for(i in 1:test_n){for(j in (i+1):length(input_list)){
x=input_list[[i]];y=input_list[[j]]
if(length(x)>1 & length(y)>1){
if(!one.sided){ # Two-sided test
res=switch(test_m,
t.test=t.test(x,y)$p.value,
wilcox.test=wilcox.test(x,y)$p.value,
ks.test=ks.test(x,y)$p.value)
}else{
res=one.sided_test(x=list(x,y),test_method = test_method)
}
tmp=format(res,nsmall=nsmall,digits=1,scientific=F)
if(nchar(tmp)>=n_of_numbers){tmp=format(res,nsmall=nsmall,digits=digits,scientific=T)}
}else{tmp=1}
test_res=c(test_res,tmp)
names(test_res)[length(test_res)]=paste0(names(input_list)[i],'_&&_',names(input_list)[j])
}}
# Remove non-sig pairs?
if(!ns_visualize){test_res=test_res[as.numeric(test_res)<0.05]}else{
test_res[as.numeric(test_res)>0.05]=paste0('NS(',test_res[as.numeric(test_res)>0.05],')')}
# e-0 to E-
test_res=gsub(test_res,pattern = 'e-0',replacement = "E-")
test_res=gsub(test_res,pattern = 'e-',replacement = "E-")
#================================
# Draw barplot using GGPlot2
#================================
library(ggplot2)
library(ggsignif)
# Make list into data.
x=input_list
x1=ldply(1:length(x),function(k){ #k=1
k1=x[[k]]
k2=data.frame(Group=names(x)[k],Value=mean(k1,na.rm=T),Std=sd(k1,na.rm = T))
return(k2)
})
x1[,-1]=as.num.mat(x1[,-1])
# Calculate standard deviation
x.std=llply(1:length(x),function(k){
sd(x[[k]])
})
# Barplot main
# Y axis range
x2=ggplot(x1,aes(Group,Value))+
geom_bar(aes(fill = Group),stat='identity', position = 'dodge',width = .5)+
geom_errorbar(aes(ymin=Value-Std,ymax=Value+Std),width=0.2,
position = position_dodge(0.9))+
theme_classic()
# Y axis label
x3=x2 +labs(title = title,x=xaxis_lab,y=yaxis_lab)
# Stat label
if(length(test_res>0)){
# Get coordinates
coord.x=ldply(names(test_res),function(k){ #k=names(test_res)[1]
k1=unlist(strsplit(k,'_&&_'))
wh=which(names(input_list) %in% k1)
k2=c(wh[1],wh[2])
return(k2)
})
coord.y=unlist(llply(names(test_res),function(k){ #k=names(test_res)[1]
k1=unlist(strsplit(k,'_&&_'))
wh=which(x1$Group %in% k1)
k2=which.max(abs(x1$Value[wh]))
k3=c(x1$Value[wh][k2]*1.1)
return(k3)
}))
if(any(duplicated(coord.y))){
dup.n=sum(duplicated(coord.y))
coord.y[which(duplicated(coord.y))]=coord.y[which(duplicated(coord.y))]*seq(1,1+dup.n/100,length.out = dup.n)
}
# Make coodrinate text labels
x4=x3+annotate('text',x=rowMeans(coord.x),y=coord.y*1.1,label=paste0('P = ',(test_res)))
# Make sig_bar
for(i in 1:length(test_res)){
x4=x4+
geom_segment(x=coord.x[i,1],xend=coord.x[i,2],
y=coord.y[i],yend=coord.y[i])
}
}
return(x4)
}
'R관련' 카테고리의 다른 글
| [conda] R 4.2.0설치하기 (0) | 2023.02.09 |
|---|---|
| DESEQ2 (0) | 2020.12.22 |
| CMScaller (0) | 2019.09.03 |
| Efficient R coding-data formatting (0) | 2019.04.02 |
| GSEA enrichment plot (0) | 2019.02.27 |